
Your English Guru is here. PLZ, STAY CLOSE AND SAY HELLO TO US: 01633686868 E-mail: englishwithyeasir@gmail.com
Thursday 30 May 2013
IELTS Speaking : Sample Answer to Spoken Topics
Describe the best present/gift you have received:
Last year , my wife celebrated my birthday at home. She
bought a electronic dictionary as birthday gift. I like the electronic
dictionary very much. It's blue and quite small. It fits into my pocket. I
remember at that time, my wife said to me :"she decided to immigrate to Canada
with me. In future, we must study very hard .And she hoped that the electronic
dictionary could help me to improve my English." On that day, I was very happy
because my wife agreed to immigrate to Canada finally. Also, with the help of
the electronic dictionary, I made such rapid progress that before long I began
to write articles in English.
1) In China, when will people send the present? Oh, attend the party, such as Wedding Party, Birthday Party. During Spring Festival, people give presents each other, including clothes, books, flowers and foods. 2) Compare the gift which people have received 10 years ago to the present that people now are receiving, what's the difference between them? ( try to compare the gift you received in your teenage with the gift children received now ) Oh, I think the gift was monotonic before. For example, I often received a notebook as gift. But now, there are various gifts to choose from. Such as flowers, wine, food, clothes etc. 3) Just image the gift in the future children will receive. In the future, I think more and more children will receive intellectual gifts, such as electronic dictionary, notebook computer and so on. 4) Just image the gift in the future people will receive. In the future, oh, in most case, people will give flowers each other. I think flowers will be the most popular present.
I think the interesting building is the Great Wall. It
runs across north China like a huge dragon. It was used to enemies. Soldiers
used to keep watch on the Great Wall. When the enemy came , fires were lit to
warn other soldiers. I think the Great Wall is the most interesting building.
Because it is one of the wonders of the world and it was one of the few man-made
objects on earth that could be seen by the astronauts who landed on the moon.
Also, the Great Wall has become a symbol of both China's proud history and its
present strength.
1) Are there some old buildings in your hometown? Where and Describe it? Wenfeng Tower, built in 1420, is located in the southern of Anyang City. During the Ming and Qing dynasties, people came to the tower to worship the God of Heaven and pray for a good harvest. Nowadays, it serves as a museum of history. Murals of Wenfeng Tower give visitors a feel for the great artistic achievements of ancient Chinese civilization. In a word, I think the Wenfeng Tower is the most interesting building, and it is the oldest building in my hometown. 2) Compare the differences between the constructions in your city with them in 20 years ago? Describe the building styles in detail? The traditional buildings are made of the red brick and always have curved eaves. Thousands of buildings look the same. But now, various buildings with different colors and styles have been going up in my hometown. In addition, room is equipped with kitchen and bathroom. This is very convenient. 3) What are people's attitudes to old building today and that of our later generation? Should we protect them? Why? People, including our later generation, advocate that government should protect old buildings .Because old buildings represent the great artistic achievements of ancient Chinese civilization. 4) What role do you think the old and modern buildings play in the society? Oh, modern buildings are for us to live and work, while old buildings are for us to visit and research. 5) Compare the differences between house and apartment? In China, there is a big yard beside house, where we can plant some flowers and trees etc. But house is more expensive. Apartment is convenient and cheap but small.
Tell me the way you make friends with others and
youu think what people should be your friends?
My best friend is xxx. We were in the same class for 5 years. At that time, we often gather together to study and play. Now, we work in the same company. Friendship is extremely important to me. It’s like being brothers or sisters, but even more than that. I mean, I would do nearly anything for my friend, and I would expect that he would do the same for me. If he didn't help me when I was in need, then I would not consider him a good friend. I have a lot of different kinds of friends. Some are loud, others are shy. I prefer having a real variety of friends. 1) Do you think it is easy to make friends in China? Yes, of course. Nowadays, transportation and communication are easy and convenient. We have more opportunities to meet all kinds of people and make friends with them. 2) what do you think the difference between adults and children making friend? The difference is attitude or mindset between adults and children making friend. In general, children like to make friend with good students because they can help each other in studying. But adults make friends with anyone they like. 3) How do children make friend? Children to children. 4) What is the most important thing in friendship? Trust. 5) What is the second important thing in friendship? Helping each other. 6) What makes friendship break up? Misunderstanding. For example, when I studied in Chongqing University, one day, my roommate lost his watch. He thought I had taken it. At that moment, I was very angry but I said nothing, and then I helped him to look for the watch. Finally, we found it in his pocket. My roommate apologized to me. I forgave him his rudeness. So, I think trust is the most important thing between friends.
There are many festivals in China, such as
Spring Festival, National Day and Yuan Xiao Festival etc. The Spring
Festival is the biggest festival in China. I suppose it's somewhat like
Christmas is in western countries. Spring Festival is the only time when
all families gather together and stores and business are closed for
several days. During the Spring Festival, we eat delicious food, visit
relatives and friends, and watch TV to welcome the New Year. I also like
to try and contact some friends before and see how they’re doing and
what they’ re up to.
We give each other presents for the New Year.
Describe your latest interesting travel in detail.
Last year, I went to Shilin with my wife. Shilin, is
located about 80 kilometers from Kunming. Kunming is the capital city of Yunnan
Province .It took us 3 days to get Shilin. Shilin is famous for its large areas
of stone forests. All stones in Shilin are vividly shaped, resembling various
figures. Some stones look like a monkey, and some stones look like a bird. In a
word, the stones are fantastic. In addition, I met a classmate of Chongqing
University in Shilin. We talked about the things and persons which we remembered
in school. I think that is an interesting trip.
1) Describe some interesting things happened during your travel. Can u describe it for me? Ok. I met a classmate of Chongqing University .We talked about the things and persons which we remembered in school. I think that is an interesting thing. 2) What is your goal to travel and your reason to travel is I enjoy traveling. It is so interesting to see how other people live, and it is really an amazing way to learn about different cultures. 3) Describe the advantage and disadvantage of travel for the country Tourism is a useful source of foreign currency for the country, but sometimes so me visitors destroy cultural heritage. 4) Why China can attract people to travel? A 5,000--year cultural heritage attract more people to China. 5) Do Chinese people like to travel now? Yes, of course. Since the opening-up, transportation is easy and convenient. Also, we have ample money for the journey. 6) Which festival do people travel in and where do people travel to? We often go to resorts around National Day, such as Forbidden City, Summer Palace, and Temple of Heaven in Beijing. 7) Compare the difference about traveling among Chinese people between 100 years ago and now? 100 years ago, transportation was very difficult; few people could travel in China because most of people were very poor. But now, transportation is easy and convenient and we have ample money for the journey.
Last year, I went to Shilin with my wife. Shilin, located about 80 kilometers
from Kunming. Kunming is the capital city of Yunnan Province. It took us 3 days
to get there. Shilin is famous for its large areas of stone forests. All stones
in Shilin are vividly shaped, resembling various figures. Some stones look like
a monkey, and some stones look like a bird. In a word, the stones are fantastic.
Also, there is a lake in Shilin. Surrounded by green mountains and forests, the
lake is not destroyed by any pollution. Travelers can row a boat on the lake or
stroll on the shores to enjoy its special quiet beauty.
1) What measures does your government take to protect natural scenery? The government establishes protective zones of natural scenery. Educate people to protect natural environment. People who destroy natural scenery will be punished. 2) Do you think it is effective? Yes, of course. Establish protective zones can prevent pollution. 3) What role does tourism play in your country's economy? Tourism is playing a more and more important role in our country's economy. Since the opening up, the number of tourists has increased quickly, and this is a useful source of foreign currency for the country. (159 Also, tourism can accelerate other industry to develop.) 4) What should you pay attention to in travel? Safety, weather, and I think it is necessary to bring some medicine.
Give me some opinion on the transportation in your
city?
In my opinion, one of the biggest problems of transportation is traffic jams in Anyang city. It has become common to see passengers and drivers having to wait in long lines of buses and cars moving at a snail's pace on the streets during the rush hours. There are several reasons for this problem. First, the number of vehicles is increasing much more rapidly than the building of roads. Second, there seem to be too many private cars and not enough public buses. Third, many people, including drivers, pedestrians and cyclists do not obey traffic rules properly, especially at busy intersections. In my opinion, one of the biggest problems of transportation is traffic jams in Anyang city. In view of the seriousness of this problem, effective measures must be taken before things get worse. On the one hand, the government should invest more money in the building of new roads and the repairing and maintenance of old ones, particularly those in busy areas of the cities. On the other hand, the number of private cars in urban areas should be limited while the number of public buses should be increased. At the same time, it is essential that stricter traffic rules and regulations be issued to strengthen traffic control. 1) Compare the different transportation, such as between plane, train and car. Drive car to travel is convenient because we can set out at any time. But it is too slow and it may spend us much more time. Plane ticket is more expensive. So, I think train is the best transportation for me. 2) Can you just image the transportation in the future and describe it for me? In the future, the speed of car, train and plane will be faster. And, the transportation will be easier and convenient. 3) Just compare the transportation in the past and now? What transportation do you like and why? Nowadays, we have more choice on the transportation than the past. Such as tube, plane etc, even though in the small city. I like tube, because tube is safety and tube ticket is cheap.
What role do you think music plays in our life?
Just as other kinds of art, music has become an indispensable part of human culture. It brings us with nutritious spiritual foods, enriches our leisure life .In addition, music can do good to us very much. It can elicit the imagination of us. And, it teaches us how to distinguish beauty from nature. Listening to the music, I am sure you will soon be refreshed from a day's hard work and relax. 1) Can you tell me the western music's impact on the world music? Oh, it is a difficult question, the western music is definitely great, and it plays an important role on the world music. Many musical talents and eminent musicians have been trained in western country, such as Beethoven, Mozart and so on. 2) Do you think it's necessary to open a music course in high school? Yes, of course. There is usually 1 or 2 hours each week used for teaching music. I think there should be more, such as at least 3 or more. 3) What effects will take place u think to let children (students) study an instrument? Music can do good to children (students) very much. It can elicit the imagination of children (students). Also, it teaches them how to distinguish beauty from nature. 4) It’s often more easy for children to learn music than adults. Can you tell me why? Oh, that’s because it’s important to have soft fingers and palm to learn a music mechanism, such as guitar. Children have more flexible fingers and they are more likely to find the correct feeling. 5) Do u like music or not? Why? I like music. I like singing, especially in front of many people. I often sing for my friends. When they praise me, I feel happy. Also, listening to the music, I am sure you will soon be refreshed from a day's hard work and relax. 6) Describe the music you like most and tell me why? I like classic music. It usually has a slow rhythm and a pleasant melody. Listening to the music; I can soon be refreshed from a day's hard work and relax. 7) What are the differences in music between China and western countries? Oh, it is a big question; in general, the symphony of western countries is long while most of Chinese music is small piece.
What clothes do you like?
Clothes aren't only used to keep us warm. It has become a important part of modern civilization. Different nations have different styles clothes. And different styles clothes represent different cultures. All people want their life to be filled with variety, color and comfort by wearing clothes. We will have a good mood when we wear beautiful clothes. I like leisure clothes very much. Because it is not only cheap but also convenient to wear. (In addition, the material of leisure clothes is more environmentally friendly.) But I must wear work clothes when we are working. Otherwise, I will be fined. 1) What's the prescript on clothes when you are working? and just the prescript on clothes in school. We must wear work clothes ( a school uniform ) when we are working (in school). Otherwise, we will be fined.. 2) The different between the older and younger people on clothes. The older people think a lot of style and material. But the youger people would like to follow the fashion. Personality is the first consideration when younger people choose clothes. 3) Compare the differences between the clothes in ur city with them in 20 years ago. In the past, the colors and styles of clothes were very monotonic. Thousands of people look the same .But now, we can wear clothes with different colors and styles.
My family is a typical family in China. There are
grandparents, parents, a brother, my wife and I in my family. I look just like
my father. Medium build, pointed nose and dense black hair. My father is very
kind and easy going. His love is the most selfless love. I am luck enough
because I have a good father. My father has been specially thirsty for knowledge
as he had only a few years of schooling himself. He believe that knowledge can
change fate. So, my father offer more opportunity for me to study (no matter how
poor my family was) To sum up, my family is harmony and our life is very happy.
1) What do you think are the differences between families in and past and today, and what have caused these changes? In the past, there were several children in a family. But now, government has is sued "one - child policy" to limit the size of the family. So, there is only one child in a family. Couples will be punished financially if they have more than one child. This is "one - child policy". 2) What is your opinion of "one--child policy"? I agree with one--child policy. Because it is difficult to provide enough food and education for a large number of people. So, government must control the population. Also, it is the best way that we can find to control population. 3) What has your government done to support families? Such as Project Hope . It means that government supports the students in poor families to continue their schooling and improving their education conditions. In addition, our government establishs beadhouse to provide services for old people who have more difficulties or no families to take care of them.
I think my first English teacher has greatly
influenced me in my education. I had some trouble in studying English when I
studied in middle school. I felt English was very difficult,so I did't like to
study it .One day, my English teacher spoke to me about the study of foreign
languages . He said :" You must do a lotof reading , listening and speaking.
Never mind, keep on trying, I believe you are a good student." In the years that
followed, I studied hard and made greater progress. My English teacher loved his
job and he was knowledgeable in his field. I love and respect him.
1) compare the differences between education in ur city with them in 20 years ago? In the past, many children can't go to school, and educational conditions were very poor. But now, government provide 9 years compulsory education. Each child who is 7 years old must go to school. And government provide much better facilities and staff. Also, schoolyards are beautiful than before. 2) compare the differences between university and middle school. We study basic knowledge in the middle school. But the course of university is practical and special, such as computer and business courses. 3) compare the differences between students now and past. At present , it is difficult for student to find job. So, their pressure is he avier than before.
Describe an interest or hobby that you
particularly enjoy:
What do you think about the balance between the
work and the leisure?
I am a big table tennis fan, even though I am not very good at playing table ten nis myself. I love to watch the game on TV. I have played table tennis whenever I get a chance since I studied in the middle school. Playing table tennis not only refreshes my body and makes me mentally alert ,and ready and eager to engage in the work of the day. In addition, a reasonable amount of exercise prepares the bo dy for a good night's sleep. However, over-indulgence in physical exercise can do more harm than good. Because it will make you too tired to stay awake during the work. 1) Is it dangerous for people to spend too much time on hobby? Yes, over-indulgence in physical exercise can do more harm than good. I have noticed that some of my friends spend too much time on sports make themselves too tired to stay awake during the work. 2) Do you think hobby is beneficial to social life? Yes, of course.I make many friends during playing table tennis. So, I think that hobby is beneficial the social life. 3) Why do people like to watch games? Oh, it is a interesting question. Watching games can enrich our leisure life. Also, it is very exciting to watch a close game. 4) What is advantages and disadvantages for watching games? Watching games can enrich our leisure life. Also, it is very exciting to watch a close game. But over-indulgence in watching games can affect our rest. 5) What is the advantages and disadvantages between watching games and playing games/sports? Watching games can enrich our leisure life. Also, it is very exciting to watch a close game. Take part in sports can build our bodies and keep us healthy. But, over-indulgence in watching games or in physical exercise can affect our rest. 6) Do you think which sports demand enough courage? Oh, I think it is boxing . It is very dangerous and it can do harm to health of athlete. 7) What are the sporting facilities like in your hometown? Anyang City has a lot of modern indoor facilities offering bowling, table tennis, swimming etc. But , it's too expensive for most Chinese, and you have to belong to the club in order to use the facilities.
I read newspapers everyday, such as Workers Daily,
Henan Daily. I enjoy reading.
It is so interesting to see how other people live and it is really an amazing way to learn about different cultures. In addition, reading can do good to us very much. It can elicit the imagination of us . I also like to read the China Today and China Daily. Both of these magazines are in English , and it is a good way for me to improve my English. 1) Do you like to discuss with others when you read books? Yes, I do . Because it is easy to understand the difficulty of books. 2) How long do you read? Usually, I read books or newspapers for 1 hour before I go to bed. 3) where do you like to read? In the library, because there are all kinds of books which I can read.
Decribe a handcraft which is made by yourself Kite flying
is popular in China. Kites are often played with around the Qingming Festival in
April. I like kites very much and I can make kites myself. Once, I made a kite.
It was a beautiful swallow. Firstly, I collected 3 sticks and paper. The paper
was adorned with paintings. Secondly, I used 3 sticks to control the paper, one
linked to its neck, the other two linked with its wing. And then, the work was
completed. The kite flew lightly in the sky as if the swallow was greeting the
coming of the spring season.
What handcraft are there in China? Folk papercuts, lanterns and kites, shadow play etc.
Sichuan dish features pungent, spicy and salty flavors
and tend to go well with rice. Sichuan Restaurant is the largest restaurant in
Anyang City. The restauran t is a beautiful, clean and it's price is cheap. My
wife and I often have dinner in the restaurant on the weekend. Stir--Fried
Shredded Beef is one of the restau rant's best dishes. It's made of fresh
tenderloin and celery. Condiments include vinegar, rice wine and ginger etc.
When finished cooking, the beef is red and the vegetables are green. The dish is
very delicious.
extension of the card topic: 1) What is the general ideas about fast food among Chinese people? Although fast food has little nutritional value, but it is a blessing for busy people. Few people eat fast food all the time usually for breakfast and/or lunch so they can help to balance their diet by eating a sensible evening meal. And I like to eat fast food. 2) what do you think about science in food processing(production)? Scientific processing(production) is important. Because it can keep us healthy. 3) what is your opinion on food production and the world's population. At present, it's difficult to provide enough food for world's population. So, on the one hand, we should limit population of world. On the other hand, we should manage to provide enuogh food.
In Anyang City, pollution is serious. With the
development of modern agriculture and industry, more and more waste is produced.
Most of this waste is harmful. It goes into the water, the soil and the air.
Especially the air is often made very dirty by factories. In places around big
factories , trees and vegetables are often killed by the bad air. Also, when we
breathe the air, harm will be done to our health. Fortunately, people are
beginning to realize just how serious the whole situation is. Government is
taking measures to prevent pollution.
What has your government done to prevent pollution The measures are: 1) First, all new projects are to have lower discharge levels. 2) Second, all sources of pollution must be identified and monitored. 3) Third, all enterprises should assure a clean and safe work place.
I plan to learn computer science in the future. I am
very interested in it. There are too many things that I don't know about
computers. Also, computers play an important role in our life and are of great
use in every field. I think the whole society will be computerized soon. I need
more knowledge in this field to meet the great demands of the application of
computers. If things go well, I'd like to further my study in computer science
and I want to work on my Master's degree in Canada.
1) What's the most important skill nowadays? I think it is computer. Because computers play an important role in our life and are of great use in every field. 2) Are there any traditional skill in your country? what are they? Yes, such as sewing and weave cloth. I remembered that my grandmother used to sew clothes herself. But now, few people can do it. 3) Do you think it necessary to learn these skills? No, I just don't like to spend much time on sewing. Because we can buy all kinds of clothes in shop. 4) Is there any difference between your parents' study and nowadays children? In the past, when our parents studied in school, educational conditions were very poor. But now, children are lucky enough because government provides much better facilities and staff. 5) Do schools teach non-academic courses? Yes, of course ,such as music, physical education, and painting etc. 6) Should school responsible for teaching these non-academic courses? Yes, of course. Because school should stress student's moral, intellectual and physical development in a comprehensive way. | |||||||||||||||||||||||||||||||||||

IELTS process writing sample
In this IELTS process writing sample, the manufacture of tea is described.
A process diagram is different to a graph or chart and requires some different language structures (though you still need to compare and contrast the various stages in the process where possible).
Particular language structures that you need to be aware of are the passive and time phrases.
Now, take a look at this question and the tea process below, and then study the model answer and comments below.
IELTS Process - Tea Production
You should spend about 20 minutes on this task.
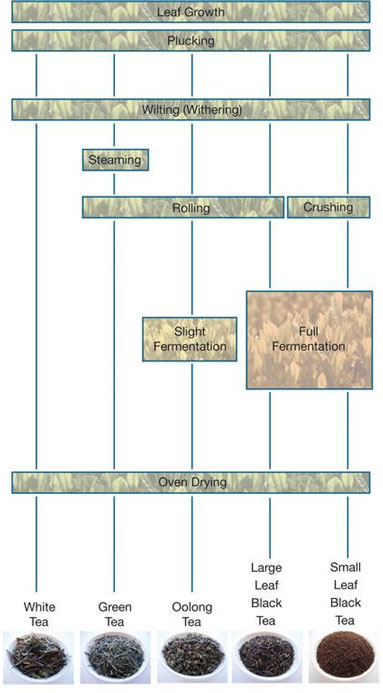
The diagram shows how tea leaves are processed into five tea types.Write at least 150 words. |
IELTS process writing sample answer
The diagram presents the manufacture of five different types of tea. It is immediately apparent that although all the teas are produced from the same leaf, the differences in the manufacturing process result in five different types of tea.
The first three stages of manufacture are the same for all of the five teas. The leaves are grown, they are then plucked, and following this withering of the leaves occures. The final stage is also the same, which sees all the leaves dried in an oven. However, in the stages in between this, differing methods of production are employed.
To begin, white tea is unique as it involves no other processing. In contrast, green, oolong and large leaf black tea are all rolled as part of the process. However, while green tea is steamed before being rolled but is not fermented, the other two teas are first rolled and then both fermented (oolong only slightly but large leaf black completely). Finally, small leaf black tea is neither steamed nor rolled, but is crushed before being fully fermented.
Comments
This IELTS process writing sample is a well-organized response that covers all the important features of the diagram.It is easy to follow as it discusses each tea in turn, but not only this, it also groups similar processes together and identifies the differences.
For example:
Similarities:The candidate decides to mention the first three stages and the last one together in one paragraph as they are exactly the same for every tea, and the differing stages in the middle following this.
The first three stages of manufacture are the same for all of the five teas.
…green, oolong and large leaf black tea are all rolled as part of the process.
Differences:
…white tea is unique as it involves no other processing.
However, while green tea is steamed before being rolled but is not fermented, the other two teas are first rolled and then both fermented.
This may seem odd to mention the stages in this order, and it is likely that when you describe a process you will discuss each stage in turn, but for this particular process it works well as the candidate can then focus on the differences.
The appropriate voice is also used in the description, which is the passive.
When we write about a process, we are interested in the actions, NOT who is doing them. In this case we use the passive voice. Here are some examples of the passive voice from this IELTS writing sample process:
...the teas are produced from the same leafIt may not always be possible, but if you can you should also try to use synonyms for some of the words from the diagram rather than copying them all.
The leaves are grown, they are then plucked
...differing methods of production are employed
For example, ‘completely’ fermented is used instead of ‘fully’.
Make sure you also make use of a mix of ‘time’ transitions to guide the reader through the description:
…they are then plucked, and following this withering of the leaves occures.The candidate also demonstrates the ability to accurately use a mix of complex structures necessary to achieve above a band 6 for ‘grammatical range and accuracy’:
…the other two teas are first rolled and then both fermented
Noun Clauses:
It is immediately apparent that although all the teas are produced from the same leaf...
Relative Clauses:
The final stage is also the same, which sees all the leaves dried in an oven.
Adverbial Clauses:
…although all the teas are produced from the same leaf
…white tea is unique as it involves no other processing.
…while green tea is steamed before being rolled but is not fermented,
IELTS - Example of a bar chart
Here you can view an example of a bar chart for the IELTS test.
This bar chart shows the levels of spending of a family on three household items - gas, food and clothing.
You should note first of all that the bar chart is over time which means you need to use the language of change.
You should also make sure that you are comparing and contrasting the items too.
Take a look at the graph and model answer, then view the comments below on the response in order to see how you can improve your answers.
Example of a bar chart
You should spend about 20 minutes on this task.The bar chart shows the monthly spending in dollars of a family in the USA on three items in 2010. Summarize the information by selecting and reporting the main features and make comparisons where relevant.Write at least 150 words. |
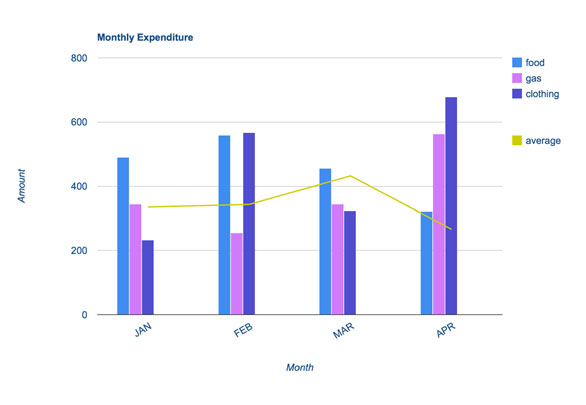
The bar chart depicts the monthly expenditure on food, gas and clothing of a family living in the USA in 2010. Overall, it can be seen that levels of expenditure fluctuated over the period.
To begin, in January the most money was spent on food, at approximately $500 per month. Although expenditure on food increased slightly the following month, it then fell to account for the lowest expenditure of all the items at the end of the period at just over $300.
Gas appeared to follow the opposite pattern to food spending. It started lower at about $350 per month, falling in the following month, and then increasing significantly to finish at just under $600 in April.
Clothing, which at just over $200 accounted for the lowest expenditure at the beginning of the period, fluctuated dramatically over the time frame. After reaching around the same levels as food in February (nearly $600), it dropped markedly in March, then jumped to just under $700 in the final month.
With the exception of an increase in March, average spending decreased slightly over the four months.
(183 words)
Comments
This example of a bar chart satisfies the requirements of the task.The first paragraph introduces the graph (without copying from the rubric) and then identifies the main trends.
It is clearly organized, with each item clearly explained in each paragraph.
Importantly however, even though each item is described in turn, the description does not just describe each item in isolation. You will notice that comparisons are made between the items throughout the description.
For example:
...it then fell to account for the lowest expenditure of all the items at the end of the period...There is also evidence that the candidate knows how to write complex sentences:
Gas appeared to follow the opposite pattern to food spending.
Clothing, which at just over $200 accounted for the lowest expenditure at the beginning of the period,...
Although expenditure on food increased...
Clothing, which at just over...
After reaching...
IELTS Task 1 Process
This is another example of an IELTS task 1 process.
This is a fairly simple example so it is good if you are new to processes. In the actual test it is likely to be a bit more difficult.
The important things to remember when you write about a process are:
- Use the passive
- Use time connectors
- Change the word forms of the vocabulary given in the process diagram
IELTS Process - Chocolate Production
You should spend about 20 minutes on this task.
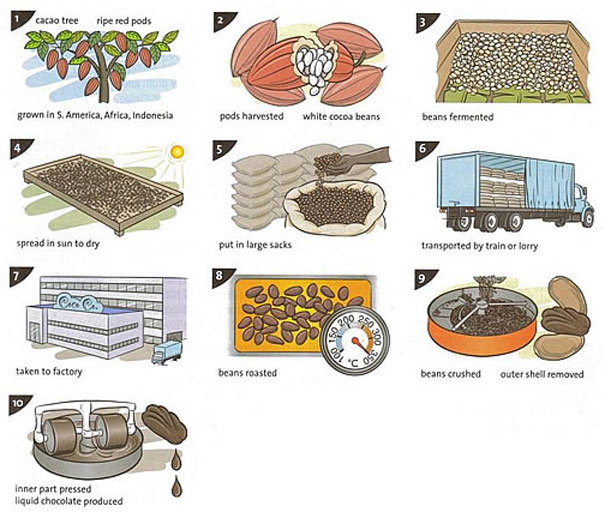
The illustrations show how chocolate is produced.Write at least 150 words. |
IELTS Task 1 Process - Model Answer
The diagram explains the process for the making of chocolate. There are a total of ten stages in the process, beginning with the growing of the pods on the cacao trees and culminating in the production of the chocolate.
To begin, the cocoa comes from the cacao tree, which is grown in the South American and African continents and the country of Indonesia. Once the pods are ripe and red, they are harvested and the white cocoa beans are removed. Following a period of fermentation, they are then laid out on a large tray so they can dry under the sun. Next, they are placed into large sacks and delivered to the factory. They are then roasted at a temperature of 350 degrees, after which the beans are crushed and separated from their outer shell. In the final stage, this inner part that is left is pressed and the chocolate is produced.
(152 Words)
IELTS Tables
IELTS tables are another way of visually displaying comparative data.
This sample is comparing the spending of five countries in Europe.
What you should notice is that the table is not over time.
This means that you need to focus on the language of comparing and contrasting.
Remember to also see if there is any way that you can group the data - this will help you to write a well organized response.
Model Graph 14
You should spend about 20 minutes on this task.
The table illustrates the proportion of monthly household income five European countries spend on food and drink, housing, clothing and entertainment.Write at least 150 words. |
Proportion of household income five European countries spend on food and drink, housing, clothing and entertainment.
| Food and drink | Housing | Clothing | Entertainment | |
|---|---|---|---|---|
| France |
31%
|
7%
|
13%
|
|
| Germany |
22%
|
33%
|
15%
|
19%
|
| UK |
27%
|
37%
|
11%
|
11%
|
| Turkey |
36%
|
20%
|
12%
|
10%
|
| Spain |
31%
|
18%
|
8%
|
15%
|
The table shows the amount of household income that five countries in Europe spend per month on four items. Overall, it is evident that all five countries spend the majority of their income on food and drink and housing, but much less on clothing and entertainment.
Housing is the largest expenditure item for France, Germany and the UK, with all of them spending around one third of their income on this, at 30%, 33% and 37%, respectively. In contrast, they spend around a quarter on food and drink. However, this pattern is reversed for Turkey and Spain, who spend around a fifth of their income on housing, but approximately one third on food and drink.
All five countries spend much less on the remaining two items. France and Spain spend the least, at less than 10%, while the other three countries spend around the same amount, ranging between 13% and 15%. At 19%, Germany spends the most on entertainment, whereas UK and Turkey spend approximately half this amount, with France and Spain between the two.
(175 Words)
Sample IELTS Bar Chart
This is a sample IELTS bar chart showing the different transport modes used in a European city.
Model Graph 13
You should spend about 20 minutes on this task.
The following bar chart shows the different modes of transport used to travel to and from work in one European city in 1960, 1980 and 2000.Write at least 150 words. |
The bar chart shows the changing patterns of transport use in a European city during the period from 1960 to 2000. In brief, the chart shows that the use of the car as a means of transport dramatically increased over the period shown, while the others fell.
In detail, in 1960 the motor car was used least as a method of transport with only about 7% of the population using this method but car use grew steadily and strongly to finally reach about 37% of the population by 2000. This was a massive 5-fold increase in use.
Over this same period, however, the popularity of walking, which had been the most popular means of transport with 35% of the population in 1960 having it as their preferred way of getting around, fell to 10%. Bicycle use also fell from a high of about 27% in 1960 to just 7% in 2000.
On the other hand, bus use was more erratic being popular with almost 20% of the population in 1960 and rising to a peak of about 27% in 1980 before falling back to about 18% in 2000.
(188 Words)
IELTS Pie and Bar Chart
This model answer is for an IELTS Pie and Bar Chart combined.
Model Graph 12
You should spend about 20 minutes on this task.The pie chart shows the percentage of persons arrested in the five years ending 1994 and the bar chart shows the most recent reasons for arrest.Write at least 150 words. |

The pie chart illustrates the percentage of males and females who were arrested from 1989 to 1994, while the bar chart compares the main reasons that the different genders were arrested most recently. It is evident from the charts that males were arrested more than females and that public drinking was the most common reason for arrest for both.
To begin, the proportion of males arrested was much greater than for females. 32% were arrested compared to only 9% for women. Turning to the reasons for the most recent arrests, there were some clear differences between men and women. Men were twice as likely to be arrested for drink driving than women, at 26% and 14% respectively. Breach of order, assault, and other reasons were also slightly higher for men, all standing at around 12-18%. Interestingly though, women experienced a higher percentage of arrest rates for assault and public drinking. The figures for assault were fairly similar at approximately 18%, whereas public drinking represented the main reason for arrest, with women at a massive 38%, compared to 31% for men.
(180 Words)
IELTS Line Graph Examples
Continuing with the sites IELTS line graph examples, this is an example of a line graph comparing car theft.
You should spend about 20 minutes on this task.
The line graph shows thefts per thousand vehicles in four European countries between 1990 and 1999. Summarize the information by selecting and reporting the main features and make comparisons where relevant.Write at least 150 words. |

The line graph compares the number of car thefts per thousand of the population in four countries from 1990 to 1999. Overall, it can be seen that car thefts were far higher in Great Britain than in the other three counties throughout the whole time frame.
To begin, car thefts in Sweden, France and Canada followed a fairly similar pattern over the first five years, all remaining at between 5 and 10 per thousand. The general trend though for France and Canada was a decline in the number of vehicles stolen over the period, with both at around 6 in 1999. In contrast, Sweden experienced an upward trend, starting the period at approximately 8, and finishing at just under 15.
Interestingly, car thefts in Great Britain started at 18 per thousand, which far exceeded that of the other countries. It then fluctuated over the next nine years, reaching a peak of 20 thefts per 1000 in 1996, and ending the period slightly lower than where it began, at approximately 17 per thousand.
(Words 173)
IELTS Line and Bar Chart
This is an example of two graphs together - a line and bar chart.
You should spend about 20 minutes on this task.The line graph shows visits to and from the UK from 1979 to 1999, and the bar graph shows the most popular countries visited by UK residents in 1999.Write at least 150 words. |

IELTS Line and Bar Chart - Model Answer
The line graph illustrates the number of visitors in millions from the UK who went abroad and those that came to the UK between 1979 and 1999, while the bar chart shows which countries were the most popular for UK residents to visit in 1999. Overall, it can be seen that visits to and from the UK increased, and that France was the most popular country to go to.
To begin, the number of visits abroad by UK residents was higher than for those that came to the UK, and this remained so throughout the period. The figures started at a similar amount, around 10 million, but visits abroad increased significantly to over 50 million, whereas the number of overseas residents rose steadily to reach just under 30 million.
By far the most popular countries to visit in 1999 were France at approximately 11 million visitors, followed by Spain at 9 million. The USA, Greece, and Turkey were far less popular at around 4, 3 and 2 million visitors respectively.
(Words 171)
Sample IELTS Bar Graph
Here is an IELTS sample bar graph on the topic of British emigration.
This chart is over time, so it uses the language of change as well as language of comparison and contrast.
IELTS Writing Task 1 - Example 9
You should spend about 20 minutes on this task.The chart shows British Emigration to selected destinations between 2004 and 2007.Write at least 150 words. |

IELTS Bar Chart Model Answer
The bar chart shows the number of British people who emigrated to five destinations over the period 2004 to 2007. It is evident from the chart that throughout the period, the most popular place to move to was Australia.
Emigration to Australia stood at just over 40,000 people in 2004, which was approximately 6,000 higher than for Spain, and twice as high as the other three countries. Apart from a jump to around 52,000 in 2006, it remained around this level throughout the period.
The next most popular country for Britons to move to was Spain, though its popularity declined over the time frame to finish at below 30,000 in 2007. Despite this, the figure was still higher than for the remaining three countries. Approximately 20,000 people emigrated to New Zealand each year, while the USA fluctuated between 20-25,000 people over the period.
Although the number of visitors to France spiked to nearly 35,000 in 2005, it was the country that was the least popular to emigrate to at the end of the period, at just under 20,000 people.
(Words 179)
Sample Pie Chart - IELTS Task 1
This is a sample pie chart for IELTS task 1.
In this example, there are four pie charts that you have to compare.
Model Graph 8
You should spend about 20 minutes on this task.The pie charts show the electricity generated in Germany and France from all sources and renewables in the year 2009. Summarize the information by selecting and reporting the main features and make comparisons where relevant.Write at least 150 words. |

The four pie charts compare the electricity generated between Germany and France during 2009, and it is measured in billions kWh. Overall, it can be seen that conventional thermal was the main source of electricity in Germany, whereas nuclear was the main source in France.
The bulk of electricity in Germany, whose total output was 560 billion kWh, came from conventional thermal, at 59.6%. In France, the total output was lower, at 510 billion kWh, and in contrast to Germany, conventional thermal accounted for just 10.3%, with most electricity coming from nuclear power (76%). In Germany, the proportion of nuclear power generated electricity was only one fifth of the total.
Moving on to renewables, this accounted for quite similar proportions for both countries, at approximately 15% of the total electricity generated. In detail, in Germany, most of the renewables consisted of wind and biomass, totaling around 75%, which was far higher than for hydroelectric (17.7%) and solar (6.1%). The situation was very different in France, where hydroelectric made up 80.5% of renewable electricity, with biomass, wind and solar making up the remaining 20%.
(Words 183)
Sample IELTS Bar Graph
This is a model of an IELTS bar graph. The topic is team scores.
Example 7
You should spend about 20 minutes on this task.
The bar chart shows the scores of teams A, B and C over four different seasons. Summarize the information by selecting and reporting the main features and make comparisons where relevant.Write at least 150 words. |

IELTS Bar Graph - Model Answer
The bar chart shows the scores of three teams, A, B and C, in four consecutive seasons. It is evident from the chart that team B scored far higher than the other two teams over the seasons, though their score decreased as a whole over the period.In 2002, the score of team B far exceeded that of the other two teams, standing at a massive 82 points compared to only 10 for team C and a very low 5 for team A. Over the next two years, the points for team B decreased quite considerably, dropping by around half to 43 by 2004. In contrast, team A’s points had increased by a massive 600% to reach 35 points, nearly equal with team B. Team C, meanwhile, had managed only a small increase over this time. In the final year, team B remained ahead of the others as their points increased again to 55, while team A and C saw their points drop to 8 and 5 respectively.
(Words 168)
IELTS Sample Bar Chart
IELTS Writing Task 1 - Example 6
You should spend about 20 minutes on this task.
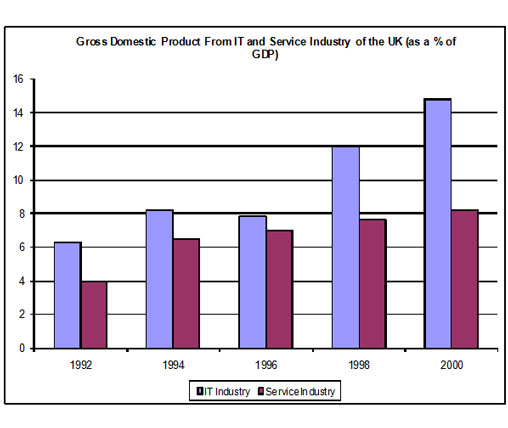
The chart shows components of GDP in the UK from 1992 to 2000. Summarize the information by selecting and reporting the main features and make comparisons where relevant.Write at least 150 words. |
Gross Domestic Product in the UK
Model Answer
The bar chart illustrates the gross domestic product generated from the IT and Service Industry in the UK from 1992 to 2000. It is measured in percentages. Overall, it can be seen that both increased as a percentage of GDP, but IT remained at a higher rate throughout this time.At the beginning of the period, in 1992, the Service Industry accounted for 4 per cent of GDP, whereas IT exceeded this, at just over 6 per cent. Over the next four years, the levels became more similar, with both components standing between 6 and just over 8 per cent. IT was still higher overall, though it dropped slightly from 1994 to 1996.
However, over the following four years, the patterns of the two components were noticeably different. The percentage of GDP from IT increased quite sharply to 12 in 1998 and then nearly 15 in 2000, while the Service Industry stayed nearly the same, increasing to only 8 per cent.
At the end of the period, the percentage of GDP from IT was almost twice that of the Service Industry.
Words 182
Comments
This answer meets the requirements of the task.The introduction explains what the graph is about, and gives an overview of the main points.
The body paragraphs are ordered logically and clearly. The first body paragraph discusses the first three years, where the patterns are fairly similar. This is contrasted in the second body paragraph, where the GDP of each country diverges noticably.
There are a wide variety of sentence structures and the language of change is correctly used. The correct tense - the past - is used.
IELTS Process Diagram Sample
This page illustrates an example of an IELTS process. Occasionally you will have to desribe a process in the test instead of a graph.Although this type of diagram is less common to see in the test,
it is still important to have an understanding of how to tackle this
should it arise. This is an example of the process of making bricks.A sample answer is below the diagram.
IELTS Writing Task 1 - Example 5
You should spend about 20 minutes on this task.
The diagram illustrates the process that is used to manufacture bricks for the building industry. Summarize the information by selecting and reporting the main features and make comparisons where relevant.Write at least 150 words. |
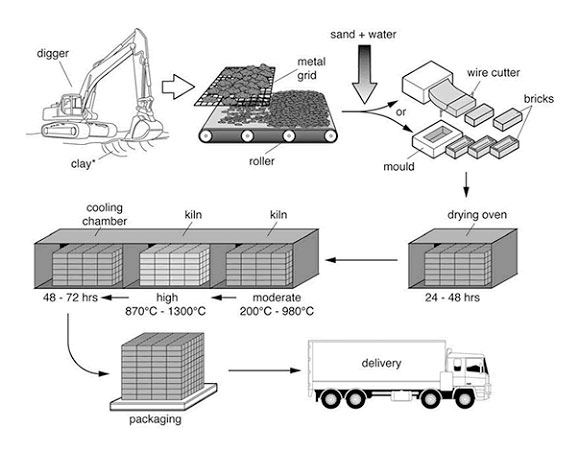
The Brick Manufacturing Process
IELTS Process Model Answer
The diagram explains the way in which bricks are made for the building industry. Overall, there are seven stages in the process, beginning with the digging up of clay and culminating in delivery.To begin, the clay used to make the bricks is dug up from the ground by a large digger. This clay is then placed onto a metal grid, which is used to break up the clay into smaller pieces. A roller assists in this process.
Following this, sand and water are added to the clay, and this mixture is turned into bricks by either placing it into a mould or using a wire cutter. Next, these bricks are placed in an oven to dry for 24 – 48 hours.
In the subsequent stage, the bricks go through a heating and cooling process. They are heated in a kiln at a moderate and then a high temperature (ranging from 200c to 1300c), followed by a cooling process in a chamber for 2 – 3 days. Finally, the bricks are packed and delivered to their destinations.
Words 173
IELTS Map - Model Task 1 Answer
Below is a Writing Task 1 IELTS map. Below the map is a model answer that has been written by an IELTS instructor.
When you write about a map, you need to focus on describing where things are in location to each other. Language such as 'to the left', 'next to', 'north of', 'behind' etc will be important.
IELTS Map - Writing Task 1
You should spend about 20 minutes on this task.
Below is a map of the city of Brandfield. City planners have decided to build a new shopping mall for the area, and two sites, S1 and S2 have been proposed. Summarize the information by selecting and reporting the main features and make comparisons where relevant.Write at least 150 words. |
Map of Brandfield with two proposed sites for a shopping mall
Model Answer
The map illustrates plans for two possible sites for a shopping mall in the city of Brandfield. It can be seen that the two sites under consideration are in the north and the south east of the town.The first possible site for the shopping mall, S1, is just north of the city centre, above the railway line, which runs from the south east of the city to the north west. If it is built here, it will be next to a large housing estate, thus providing easy access for those living on the estate and in the city centre. It will also be next to the river, which runs through the town.
The site in the south east, S2, is again just by the railway line and fairly close to the city centre, but it is near to an industrial estate rather than housing.
There is a main road that runs through the city and is close to both sites, thus providing good road access to either location. A large golf course and park in the west of the town prevents this area from being available as a site.
190 words
IELTS Writing Task 1 Table
Below is an IELTS Writing Task 1 Table. Below the table is a model answer.
With a table, you need to do much the same as you would for any other question that requires you to write about data.
In this case, the table is over time, so you would treat it like a line graph and describe the changes.
IELTS Writing Task 1 Table
You should spend about 20 minutes on this task.
The table shows the Proportions of Pupils Attending Four Secondary School Types Between Between 2000 and 2009 Summarize the information by selecting and reporting the main features and make comparisons where relevant.Write at least 150 words. |
Secondary School Attendance
2000
|
2005
|
2009
|
|
| Specialist Schools | |||
| Grammar Schools | |||
| Voluntary-controlled Schools | |||
| Community Schools |
Model Answer
The table illustrates the percentage of school children attending four different types of secondary school from 2000 to 2009. It is evident that the specialist, grammar and voluntary-controlled schools experienced declines in numbers of pupils, whereas the community schools became the most important providers of secondary school education during the same period.To begin, the proportion in voluntary-controlled schools fell from just over half to only 20% or one fifth from 2000 to 2009. Similarly, the relative number of children in grammar schools -- just under one quarter -- dropped by half in the same period. As for the specialist schools, the relatively small percentage of pupils attending this type of school (12%) also fell, although not significantly.
However, while the other three types of school declined in importance, the opposite was true in the case of community schools. In fact, while only a small minority of 12% were educated in these schools in 2000, this figure increased to well over half of all pupils during the following nine years.
Words 170
IELTS Writing Task 1 Sample: Pie Chart
This IELTS writing task 1 sample is a pie chart. Below the pie chart is a model answer written by an IELTS instructor.
IELTS Writing Task 1 Sample 2
You should spend about 20 minutes on this task.
The pie chart shows the amount of money that a children's charity located in the USA spent and received in one year. Summarize the information by selecting and reporting the main features and make comparisons where relevant.Write at least 150 words. |
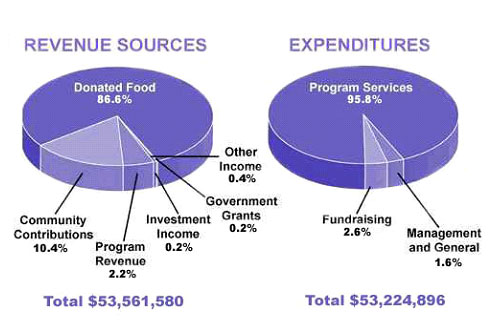
Revenue Sources and Expenditures of a USA Charity in one year.
Model Answer
The pie charts show the amount of revenue and expenditures over a year of a children’s charity in the USA. Overall, it can be seen that donated food accounted for the majority of the income, while program services accounted for the most expenditure. Total revenue sources just exceeded outgoings.In detail, donated food provided most of the revenue for the charity, at 86%. Similarly, with regard to expenditures, one category, program services, accounted for nearly all of the outgoings, at 95.8%.
The other categories were much smaller. Community contributions, which were the second largest revenue source, brought in 10.4% of overall income, and this was followed by program revenue, at 2.2%. Investment income, government grants, and other income were very small sources of revenue, accounting for only 0.8% combined.
There were only two other expenditure items, fundraising and management and general, accounting for 2.6% and 1.6% respectively. The total amount of income was $53,561,580, which was just enough to cover the expenditures of $53,224,896.
Words 164
How to Write an IELTS Writing Task 1
On the following pages you can see model answers for IELTS writing task 1 questions.
There are examples of all the different types of task which include line graphs, pie charts, tables, processes, diagrams and maps.
First, on this page, you’ll get an overview of how to answer a task 1.
Answers will always vary depending on the type of graph or diagram, and the type of language will vary, but there is a certain structure that they all follow.
Once you have studied the general structure, you can view other examples by following the links in the right hand column.
How do I answer an IELTS writing task 1?
To analyse this, we’ll look at a line graph. Look at the following question and the graph.You should spend about 20 minutes on this task.
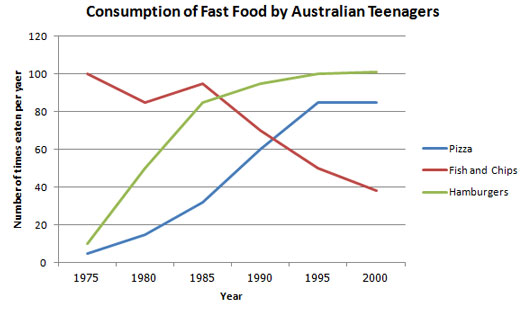
The line graph below shows changes in the amount and type of fast food consumed by Australian teenagers from 1975 to 2000. Summarize the information by selecting and reporting the main features and make comparisons where relevant.Write at least 150 words. |
There are three basic things you need to structure an IELTS writing task 1.
- Introduce the graph
- Give an overview
- Give the detail
1) Introduce the Graph
You need to begin with one or two sentences that state what the IELTS writing task 1 shows. To do this, paraphrase the title of the graph, making sure you put in a time frame if there is one.Here is an example for the above line graph:
The line graph illustrates the amount of fast food consumed by teenagers in Australia between 1975 and 2000, a period of 25 years.You can see this says the same thing as the title, but in a different way.
2) Give an Overview
You also need to state what the main trend or trends in the graph are. Don’t give detail such as data here – you are just looking for something that describes what is happening overall.One thing that stands out in this graph is that one type of fast food fell over the period, whilst the other two increased, so this would be a good overview.
Here is an example:
Overall, the consumption of fish and chips declined over the period, whereas the amount of pizza and hamburgers that were eaten increased.This covers the main changes that took place over the whole period.
You may sometimes see this overview as a conclusion. It does not matter if you put it in the conclusion or the introduction when you do an IELTS writing task 1, but you should provide an overview in one of these places.
3) Give the Detail
You can now give more specific detail in the body paragraphs.When you give the detail in your body paragraphs in your IELTS writing task 1, you must make reference to the data.
The key to organizing your body paragraphs for an IELTS writing task 1 is to group data together where there are patterns.
To do this you need to identify any similarities and differences.
Look at the graph – what things are similar and what things are different?
As we have already identified in the overview, the consumption of fish and chips declined over the period, whereas the amount of pizza and hamburgers that were eaten increased.
So it is clear that pizza and hamburgers were following a similar pattern, but fish and chips were different. On this basis, you can use these as your ‘groups’, and focus one paragraph on fish and chip and the other one on pizza and hamburgers.
Here is an example of the first paragraph:
In 1975, the most popular fast food with Australian teenagers was fish and chips, being eaten 100 times a year. This was far higher than pizza and hamburgers, which were consumed approximately 5 times a year. However, apart from a brief rise again from 1980 to 1985, the consumption of fish and chips gradually declined over the 25 year timescale to finish at just under 40 times per year.As you can see, the focus is on fish and chips. This does not mean you should not mention the other two foods, as you should still make comparisons of the data as the questions asks.
The second body then focuses on the other foods:
In sharp contrast to this, teenagers ate the other two fast foods at much higher levels. Pizza consumption increased gradually until it overtook the consumption of fish and chips in 1990. It then leveled off from 1995 to 2000. The biggest rise was seen in hamburgers, increasing sharply throughout the 1970’s and 1980’s, exceeding fish and chips consumption in 1985. It finished at the same level that fish and chips began, with consumption at 100 times a year.
Full Model Answer:
In 1975, the most popular fast food with Australian teenagers was fish and chips, being eaten 100 times a year. This was far higher than Pizza and hamburgers, which were consumed approximately 5 times a year. However, apart from a brief rise again from 1980 to 1985, the consumption of fish and chips gradually declined over the 25 year timescale to finish at just under 40 times per year.
In sharp contrast to this, teenagers ate the other two fast foods at much higher levels. Pizza consumption increased gradually until it overtook the consumption of fish and chips in 1990. It then leveled off from 1995 to 2000. The biggest rise was seen in hamburgers, increasing sharply throughout the 1970’s and 1980’s, exceeding fish and chips consumption in 1985. It finished at the same level that fish and chips began, with consumption at 100 times a year.
(191 words)
IELTS Overpopulation Essay
This model essay is about overpopulation in cities.
You specifically have to talk about the problems of overpopulation, and suggest some solutions to this problem.
Note that this question specifically asks you what governments and individuals can do.
You MUST, therefore, write about what both of these can do in order to fully answer the question.
Note as well that you must talk about serious problems.
The easiest way to organize a problems and solutions essay is as follows:
Body 1: ProblemsIn this essay, a separate paragraph has been written about government and individual solutions, so it is organized as follows:
Body 2: Solutions
Body 1: Problems
Body 2: Solutions - Government
Body 3: Solutions - Individuals
Model Essay 9
| You should spend about 40 minutes on this task. Present a written argument to an educated reader with no specialist knowledge of the following topic. Overpopulation of urban areas has led to numerous problems.Give reasons for your answer and include any relevant examples from your own experience or knowledge. You should write at least 250 words. |
IELTS Overpopulation Essay - Sample Answer
Many countries of the world are currently experiencing problems caused by rapidly growing populations in urban areas, and both governments and individuals have a duty to find ways to overcome these problems.Overpopulation can lead to overcrowding and poor quality housing in many large cities. Poorly heated or damp housing could cause significant health problems, resulting in illness, such as bronchitis or pneumonia. Another serious consequence of overcrowding is a rising crime rate as poor living conditions may lead young people in particular to take desperate measures and turn to crime or drugs.
In terms of solutions, I believe the government should be largely responsible. Firstly, it is vital that the state provides essential housing and healthcare for all its citizens. Secondly, setting up community projects to help foster more community spirit and help keep young people off the street is a good idea. For example, youth clubs or evening classes for teenagers would keep them occupied. Finally, more effective policing of inner city areas would also be beneficial.
Naturally, individuals should also act responsibly to address these problems, and the motivation to do this would hopefully arise if the measures described above are put into place by the government. This is because it will encourage people to have more pride in their own community and improve the situation.
Therefore, it is clear that the problems caused by overpopulation in urban areas are very serious. Yet if governments and individuals share a collective responsibility, then it may well become possible to offer some solutions.
(254 words)
IELTS Traffic Problems Essay
This is a traffic problems essay and the specific topic is the taxing of car drivers in order to reduce these problems.
You are asked to discuss the advantages and disavantages of introducing such a policy to tackle the issue.
This question is very clear, and it does not specifically ask you for an opinion.
You just need to look at both sides of the issue.
The logical way to answer it would be to discuss each side in a different paragraph.
Sample IELTS Writing 8
| You should spend about 40 minutes on this task. Write about the following topic: In order to solve traffic problems, governments should tax private car owners heavily and use the money to improve public transportation.Give reasons for your answer and include any relevant examples from your own experience or knowledge. You should write at least 250 words. |
Traffic Problems Essay - Model Answer
Traffic congestion in many cities around the world is severe. One possible solution to this problem is to impose heavy taxes on car drivers and use this money to make public transport better. This essay will discuss the benefits and drawbacks of such a measure.One of the first benefits of such a measure is that the heavy taxes would discourage car owners from using their cars because it would become very expensive to drive. This would mean that they would begin to make use of public transport instead, thus reducing traffic problems and pollution as well. Another benefit would be that much more use would be made of public transport if it was improved. It is often the case that public transport in cities is very poor. For example, we often see old buses and trains that people would rather not use. High taxes would generate enough money to make the necessary changes.
Nevertheless, there are drawbacks to such a solution. First and foremost, this would be a heavy burden on the car drivers. At present, taxes are already high for a lot of people, and so further taxes would only mean less money at the end of the month for most people who may have no choice but to drive every day. In addition, this type of tax would likely be set at a fixed amount. This would mean that it would hit those with less money harder, whilst the rich could likely afford it. It is therefore not a fair tax.
To conclude, this solution is worth considering to improve the current situation, but there are advantages and disadvantages of introducing such a policy.
(277 words)
Comments The topic is clearly stated in the general statement of the introduction, and the thesis tells the reader that advantages and disadvantages will be discussed.
It is organized well, with the advantages of such a solution in the first body paragraph and the disadvantages in the next.
Each paragraph has two ideas and they are well signaled and supported.
There are some good uses of tenses to show the writer is discussing the unreal future i.e. something that has not happened (would discourage car owners..., would be a heavy burden...,).
Sample IELTS Writing - Youth Crime
This sample IELTS writing is on the subject of youth crime.
In this essay, you are presented with an issue and asked to discuss the 'reasons' why it is occuring and suggest 'solutions'.
Crime is a topic that sometimes arises in IELTS essays and in speaking questions.
Be careful to identify what kind of crime is being referred to - this is specifically youth crime.
You need to give some reasons that it is happening and then give some solutions.
Sample IELTS Writing 7
| You should spend about 40 minutes on this task. Write about the following topic: Levels of youth crime are increasing rapidly in most cities around the world.Give reasons for your answer and include any relevant examples from your own experience or knowledge. You should write at least 250 words. |
Sample IELTS Writing - Model Answer
Over the last few decades, many cities around the world have seen alarming increases in the levels of youth crime. This essay will discuss the reasons for this and provide some possible solutions.The first reason is connected with the family. In order for a child to grow up in a balanced way, it is very important that he or she is nurtured well by his or her parents. However, these days, it is often the case that children are neglected. This may be because of the fact that many parents in cities now both have to work so are often not around to give their children support when needed. Another factor is the increasing levels of poverty around the world. We have seen with globalization the rich get richer and the poor get poorer, and this inevitably means that those who are poorer will have to resort to illegal means to get what others have. Of course, this will include the children in the poorer families.
However, there are ways to tackle such problems. Firstly, one of the ways to combat the problem is to have stricter punishments. Although, as discussed above, it can be outside factors that lead to crime, it is still important to have severe punishments to deter teenagers from crime. All too often, because they are young, the courts are too lenient. Parents also have to take more responsibility for their children’s actions. They too should be punished if their children commit crime.
To sum up, several factors have led to increases in youth crime, but measures are available to tackle this problem.
(267 words)
Comments The topic is clearly stated in the general statement of the introduction, and the thesis tells the reader that reasons and solutions will be discussed.
It is organized well, with reasons for youth crime discussed in the first body paragraph and solutions in the next. Each paragraph has two ideas and they are clearly signaled and well supported.
There are some good complex structures (In order for…, often the case that…, means that…,) and some good examples of topic related vocabulary (nurtured…, neglected…, illegal…, severe punishments…, deter…, commit crime…).
Subscribe to:
Posts (Atom)